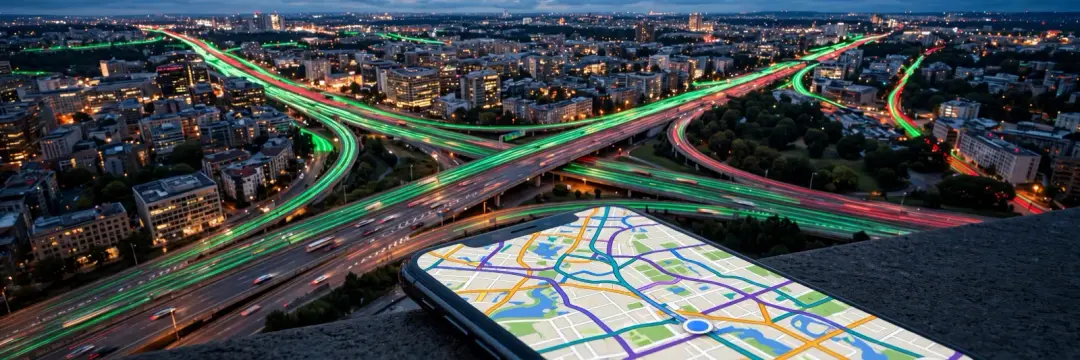
You open Google Maps, and before you have typed anything it already knows: the motorway is red, the side streets are green, and your 25-minute drive will actually take 41. But how does Google Maps know traffic? There are no cameras on every road and no one phoning in reports from every junction. The answer is simpler and stranger than most people expect: your phone is the sensor — and so is everyone else's.
The short answer: your phone is the sensor
Every phone running Google Maps (and, in many cases, Android phones with location services on) quietly reports two things: where it is — worked out using GPS, as explained in how GPS works — and how fast it is moving. Google collects millions of these tiny, anonymous reports, matches them to roads, and works out how fast traffic is flowing on each stretch right now.
If hundreds of phones are crawling along a motorway at 15 km/h where they normally travel at 110 km/h, Google knows there is a jam — no camera or human reporter needed. The more phones on a road, the clearer the picture. That is why traffic information is excellent on busy city roads and motorways, and patchy on a quiet country lane where only a handful of phones pass each hour.
The colours, decoded
Those green, orange, red and dark-red lines are not decoration. Each colour compares the current speed on a road with its normal speed at that time of day:
| Colour | What it means |
|---|---|
| Green | Traffic flowing at normal speed |
| Orange | Slower than usual — expect delays |
| Red | Heavy congestion — much slower than normal |
| Dark red | Near-standstill or road closed |
So a road can be red at 30 km/h in a city centre where the normal speed is 50 km/h, while the same 30 km/h on a motorway would be dark red. The colour is always relative to what is normal for that road — which is why a quiet road at 3 a.m. still shows green even though almost nobody is on it.
Where the data comes from
Google builds its traffic picture from four main sources:
- Anonymous phone data: speed and location pings from phones using Google Maps or Android location services. This is the biggest source, and it updates every few minutes.
- Incident reports: drivers report crashes, roadworks, closures and hazards through Google Maps and Waze — the navigation app Google bought in 2013. These reports appear as icons on the map and feed into routing.
- Historical patterns: Google has years of data on how every road behaves — rush hour on a Tuesday, school holidays, match days near a stadium. That history shapes what "normal" means for each road at each hour.
- Official data: road sensors, government transport feeds and local authority information about closures and roadworks, where available.
No single source is enough on its own. The phone data shows what is happening now; the history shows what usually happens; the reports explain why. Together they produce the live map — and every one of those reports travels over the same internet explained in our guide to how the internet actually works.
How it predicts traffic before it happens
Live data tells you about the jam you are already in. The cleverer trick is the estimated time of arrival — and the prediction that a road will be busy in 40 minutes when you have not left yet.
For that, Google uses machine learning. In 2020, Google and DeepMind introduced graph neural networks — a type of AI designed for networks like roads — to predict journey times. The model learns how traffic flows through the whole road network: how a jam on one motorway spills onto the next junction, how rain slows an entire city, how a Friday afternoon differs from a Monday morning.
The result is that your ETA is not just the distance divided by the speed limit. It is a prediction built from the current conditions, the history of that route, and what the model has learned about how congestion spreads. That is also how Maps can suggest leaving 20 minutes earlier: it has already forecast the jam you have not met yet.
Why your route changes mid-drive
If Maps suddenly reroutes you halfway through a journey, it is the same system at work. The app keeps watching live speeds along your route and compares them with alternatives in the background. If a crash ahead turns your road red and a side route would save ten minutes, it offers the switch. Accept, and your ETA updates instantly; ignore it, and Maps keeps checking. The route is never fixed — it is a live calculation that changes as the traffic does.
How accurate is it?
Mostly, very accurate — with limits worth knowing:
- On busy roads, excellent. With thousands of phones reporting, speed estimates are usually within a few minutes of reality.
- On quiet roads, weaker. With only a few phones, one slow driver can make a road look congested when it is not.
- Incidents lag. A crash appears only once enough phones slow down or someone reports it — the first few minutes are the least reliable.
- It can be fooled. In 2020, an artist famously created a fake traffic jam by pulling 99 phones in a handcart down an empty Berlin street. Google took the bait and turned the road red. The system trusts the phones, and phones can be tricked.
For everyday driving, though, the ETA is usually right within a few minutes — which is why millions of people plan their journeys around it.
What about your privacy?
The idea of your phone reporting your speed to Google sounds intrusive, so it is worth knowing what actually happens. Google says the data is anonymised and aggregated: your reports are mixed with thousands of others before anyone — including Google — looks at them, and the start and end points of trips are removed so individual journeys cannot be reconstructed from the traffic data.
You can also opt out. Turning off Location History in your Google account stops your location being stored in your timeline, and you can use Maps without signing in. The trade-off is real, though: the traffic system only works because millions of people contribute. Opt out, and you still benefit from everyone else's data — you just stop adding your own.
A short history
Google did not build this overnight. In 2004, it acquired a small company called ZipDash, which was already experimenting with using mobile phones to measure traffic. The first live traffic layer appeared in Google Maps in 2007, covering a handful of US cities. Waze joined in 2013, bringing driver reports. And in 2020, the DeepMind graph neural network upgrade made ETAs noticeably more accurate worldwide.
Each step followed the same logic: more phones, more history, better maths — and a traffic map that gets sharper the more people use it.
Takeaway checklist
- Your phone is the sensor: Google Maps learns traffic from anonymous speed and location reports from millions of phones.
- Colours are relative: green, orange, red and dark red compare current speed with what is normal for that road, not with a fixed speed.
- Four sources feed the map: phone data, driver reports (including Waze), historical patterns and official road data.
- ETAs are predictions: machine learning forecasts how congestion will spread, not just how fast traffic is moving now.
- Accuracy varies: excellent on busy roads, weaker on quiet ones, and incidents take a few minutes to appear.
- Privacy is built in: data is anonymised and aggregated, with trip start and end points removed — and you can turn Location History off.
- It can be fooled: a handcart full of phones once faked a traffic jam, so treat the map as a guide, not gospel.
Next time Maps turns a road red before you reach it, remember: it is not watching the road. It is listening to the phones on it — including, quite possibly, yours.